The Art of Data Storytelling: How Visualization Enhances Understanding
The art of data storytelling lies in the ability to transform raw figures into compelling narratives that resonate with audiences. By harnessing the power of visualization, complex data sets become digestible, allowing stakeholders to grasp key insights quickly. For instance, incorporating charts, graphs, and infographics can highlight trends and patterns that are not immediately apparent in spreadsheets. This method not only aids in comprehension but also facilitates more informed decision-making across various sectors.
Moreover, visualization serves as a bridge between data and the audience's emotional connection. When stories are woven around data points, they evoke emotions that drive engagement and action. Consider the impact of using a well-designed map to showcase demographic changes over time or a bar graph depicting the rise of renewable energy use. Such representations do more than present information—they tell a story that can inspire change, foster understanding, and encourage collaboration among diverse audiences. In essence, mastering the art of data storytelling fundamentally enhances our collective understanding of the world around us.
Top 5 Data Visualization Software Tools to Transform Your Analytics
Data visualization software plays a crucial role in converting complex data sets into compelling visual narratives. With the right tools, businesses can uncover insights that drive informed decision-making. In this article, we explore the top 5 data visualization software tools that can significantly enhance your analytics capabilities. Each of these tools offers unique features and functionalities that cater to different analytical needs, ensuring that you can find the perfect match for your data visualization requirements.
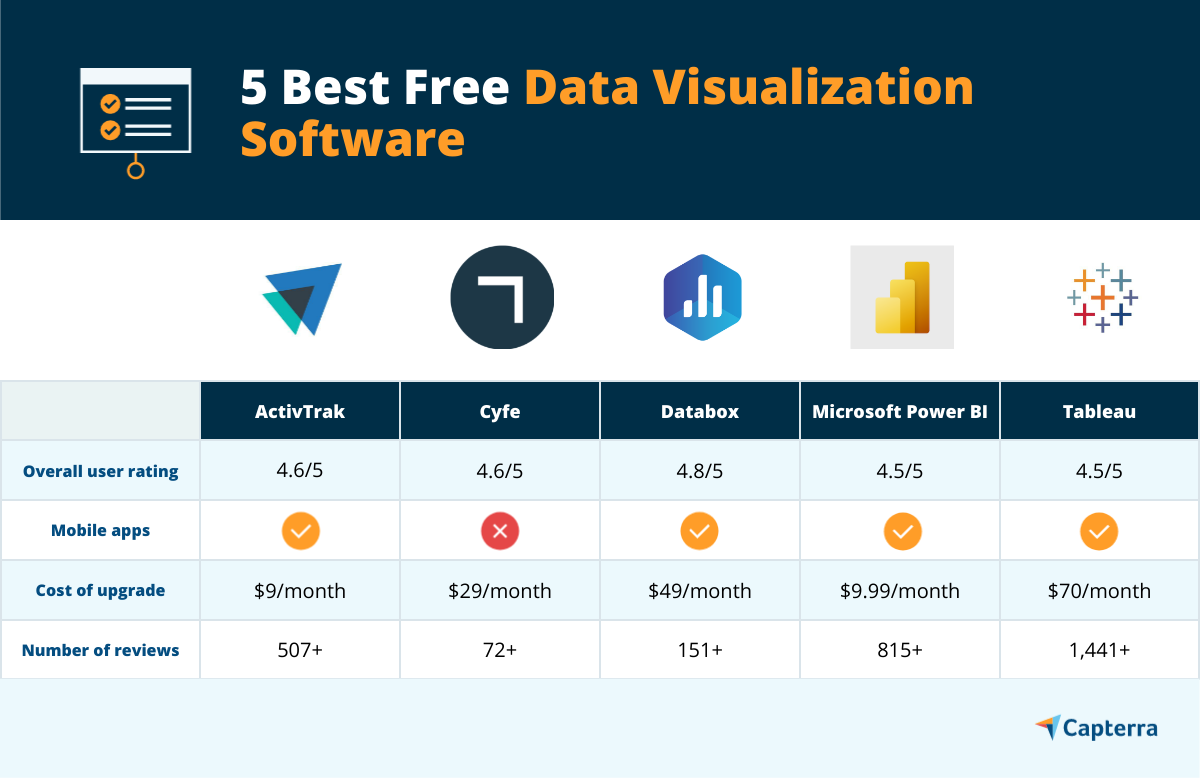
- Tableau: Renowned for its user-friendly interface, Tableau allows users to create interactive and shareable dashboards.
- Power BI: A Microsoft product, Power BI seamlessly integrates with other Microsoft services, making it an excellent choice for organizations already utilizing the Microsoft ecosystem.
- QlikView: This tool excels in associative data modeling, enabling users to explore data in more depth and discover hidden relationships.
- Looker: Looker offers a unique approach by leveraging embedded analytics and data exploration directly within business applications.
- D3.js: For those who prefer a more hands-on approach, D3.js is a JavaScript library that allows for the creation of custom, dynamic visualizations.
Why Is Data Visualization Essential for Effective Decision Making?
Data visualization plays a crucial role in effective decision making by transforming complex data into easily understandable visual formats. This process allows decision-makers to uncover patterns, trends, and insights that might be hidden within raw data. By presenting information visually, such as through charts, graphs, and dashboards, stakeholders can quickly grasp the significance of information without having to wade through pages of data. This not only saves time but also enhances comprehension, leading to more informed and timely decisions.
Moreover, data visualization fosters better communication among team members and stakeholders. When data is represented in a visual format, it becomes more engaging and accessible, facilitating discussions that are rooted in concrete evidence. For example, using interactive dashboards can help teams to identify areas needing immediate attention and prioritize actions based on visual feedback. In essence, effective data visualization acts as a bridge between complex data sets and strategic decision-making, ensuring that all stakeholders are aligned and informed.